As seen in — clients featured across
LEAD STORY · Paid Media · Organic Growth · Retention
2,412% ROAS.
Front Page of
TechCrunch.
One Agency.
Twenty specialists. One embedded department. We build campaigns the way newsrooms break stories — fast research, sharp angles, relentless iteration until the numbers move. Mid-market CMOs, franchise operators, and SaaS founders don't call us for promises. They call us when they need the funnel fixed before the board meeting.
37days
avg. days to first qualified pipeline
94%
client retention over 36 months
$4.2M
revenue attributed in a single quarter
The war room
20 specialists. Embedded. Billing like an agency. Operating like your best hire.
DATA DESK · Verified Results · 2022–2025
The Numbers Don't Negotiate
Every metric below is client-verified and available for reference on request.
Case File #01 · Mid-Market CMO
"Achieved for a DTC health brand over 90 days."
Paid social restructure, creative testing at scale, bid strategy overhaul. The CMO had inherited a $40K/mo bleed with no attribution model.
Read full case studyCase File #02 · SaaS Founder
"From signed contract to first qualified inbound for a Series A SaaS."
Content strategy, SEO architecture, and LinkedIn demand gen running in parallel from week one.
Read full case studyCase File #03 · Franchise Operator
"Franchise brand grew from 5 to 47 active locations in 18 months."
Localized paid media, franchise recruitment funnel, and brand consistency playbook across every market.
Read full case studyCase File #04 · All ICPs
"Over a rolling 36-month period."
Not because of contracts — because the numbers keep moving. Clients who stop growing stop staying. Ours don't stop growing.
Read full case studyCASE FILES · Selected Work · Three ICPs · One Standard
Who We Work For.
What We Do For Them.
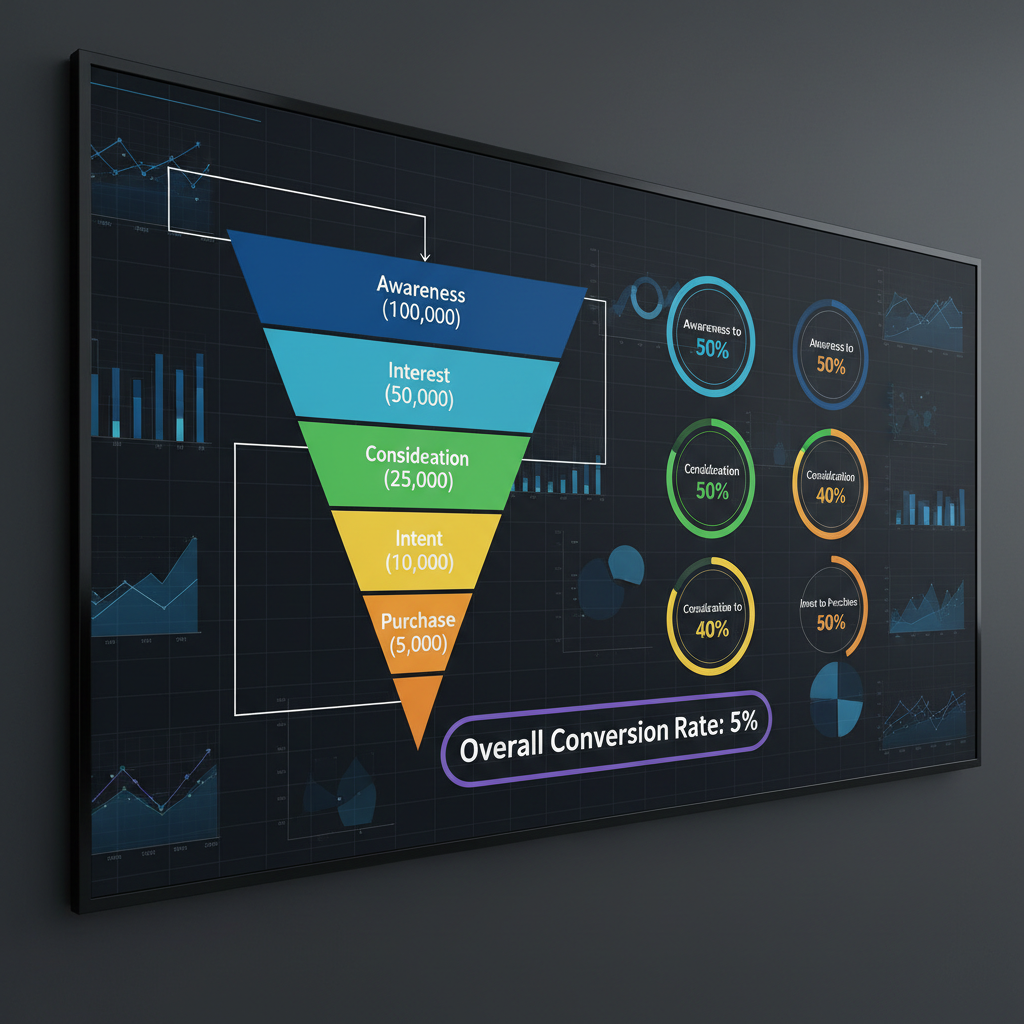
$3.8M
pipeline in 90 days
Inherited a broken funnel. Left with a forecasting model.
The CMO came in from a Fortune 500 and found a $180K/mo paid spend with zero attribution. We rebuilt the tracking layer, consolidated 11 campaigns into 4 with proper audience architecture, and introduced a weekly creative testing cadence. By week 12, CAC dropped 61% and pipeline velocity tripled.
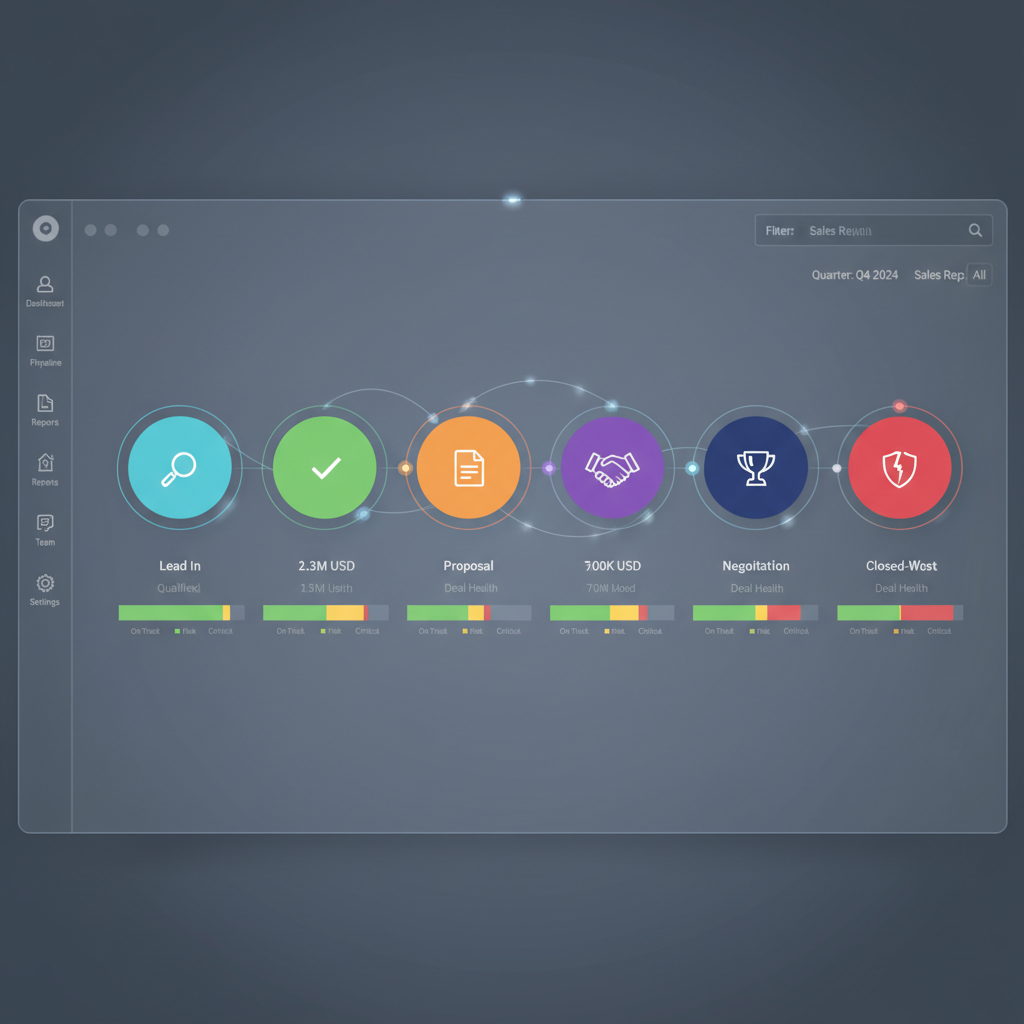
37
days to first pipeline
Post-Series A. Zero inbound. 37 days later.
Founder had raised $6M and was still relying on a freelance SEO and a part-time PPC manager. We embedded a 6-person pod, rebuilt the ICP definition, launched LinkedIn demand gen, and stood up a content engine. The first qualified inbound arrived on day 37.

5 → 47
locations in 18 months
From regional gym chain to national franchise.
National franchise expansion required a completely different marketing architecture — localized paid media per market, a franchise recruitment funnel, and brand governance across 47 independently operated locations. We built the playbook, trained internal teams, and ran the media.
94%
36-month client retention
We don't write contracts that trap clients. We write results that keep them.
Across our entire client history, 94% of clients who complete their first 6 months renew for at least another year. The other 6% were acquired, promoted internally, or paused due to funding. Not one churned due to performance.
WAR ROOM DISPATCH · Methodology · The Four-Phase Framework
How We Break Stories.
How We Move Numbers.
Most agencies present a roadmap. We present a war room protocol — the same one we've run for 47 client engagements across three verticals. The sequence is non-negotiable. The speed is the differentiator.
01
Days 1–5
72 hrs
avg. time to first insight
Intelligence Gathering
We audit your existing stack before touching a single campaign. Attribution model, audience architecture, creative library, competitive positioning, and funnel velocity metrics. Most clients are shocked by what we find in the first 72 hours.
Deliverable
Funnel Diagnostic Report + Priority Matrix
Phase 1 of 4
02
Days 5–14
3×
faster than traditional briefing
Angle Architecture
Every campaign needs a sharp angle — a specific claim for a specific audience that a competitor can't easily copy. We run rapid-fire creative concepting, message testing, and ICP validation before spending a dollar on media.
Deliverable
3 Validated Angles + Creative Brief Package
Phase 2 of 4
03
Days 14–37
48 hrs
creative replacement cycle
Launch & Iterate
We ship fast, measure everything, and kill what isn't working before the weekly report. No waiting for a monthly review to pivot. Our war room operates on a 48-hour feedback loop — if a creative dies on Tuesday, a replacement is live by Thursday.
Deliverable
Live Campaigns + Weekly Performance Dispatch
Phase 3 of 4
04
Day 37+
61%
avg. CAC reduction at scale
Scale the Winners
Once a channel or creative angle proves itself, we scale deliberately — not recklessly. Budget reallocation follows a strict efficiency threshold. We've seen too many agencies blow up a working campaign by scaling prematurely.
Deliverable
Scaling Playbook + Quarterly Revenue Model
Phase 4 of 4
20
War room specialists
47
Client engagements
3
Vertical focus areas
6yr
Average specialist tenure
FREE AUDIT · No Sales Call Required
We'll Tell You Exactly
What's Leaking Revenue.
Submit your company URL and current monthly spend. We'll return a written audit within 5 business days — no discovery call required, no obligation to engage. If we find nothing, we'll say so.
47
Audits completed
5 days
Avg. turnaround
0
Hidden fees